|
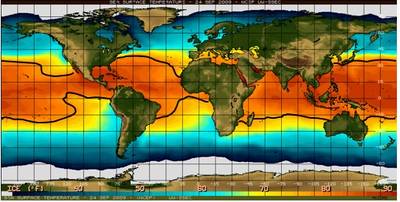
Global sea surface temperature
Sea Surface Temperature (SST) image for the global ocean, based on data gathered on September 24, 2009. Blue an green colors indicate cooler waters (less than 15.6°C [60°F]) while orange and red colors, outlined by the black curves, indicate warmer waters (at least 26.5°C [~80°F]). Image courtesy of the Space Science and Engineering Center, University of Wisconsin-Madison.
|
|