|
Tropical Cyclone Track Forecast Cone and Watch/Warning Graphic
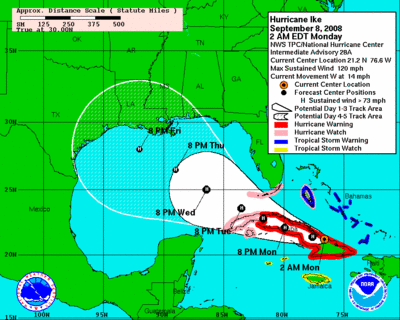
Tropical Cyclone Track Forecast Cone and Watch/Warning Graphic for Hurricane Ike (2008). This graphic depicts the NHC forecast track of the center of a hurricane along with an approximate representation of associated coastal areas under a hurricane warning (red), hurricane watch (pink), tropical storm warning (blue), and tropical storm watch (yellow). The orange circle indicates the current position of the center of the tropical cyclone. The black dots show the NHC forecast position of the center at the times indicated. The letter inside the dot indicates the forecast strength of the cyclone category: (D)epression, (S)torm, (H)urricane, (M)ajor hurricane, or remnant (L)ow. Systems forecast to be extratropical are be indicated by white dots (with black letters indicating intensity). The cone represents the probable track of the center of a tropical cyclone, and is formed by enclosing the area swept out by a set of circles (not shown) along the forecast track (at 12, 24, 36 hours, etc). The size of each circle is set so that two-thirds of historical official forecast errors over a 5-year sample fall within the circle.
|
|