|
Graphical Tropical Weather Outlook
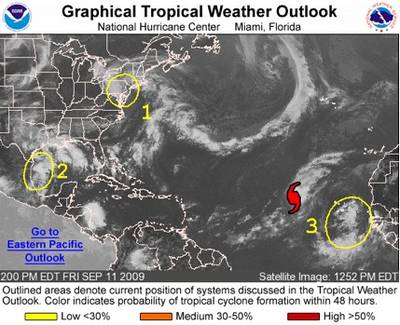
Graphical Tropical Weather Outlook from September 11, 2009. This graphic depicts significant areas of disturbed weather and their potential for development of a tropical cyclone during the next 48 hours. The Outlook also shows the locations of any active tropical depressions ("L"-symbol), tropical storms (tropical storm symbol with hollow center), and hurricanes (hurricane symbol with filled center). Areas of disturbed weather on the graphic are circled and numbered, with text discussions for each disturbance given beneath the graphic. The potential for tropical cyclone formation for each disturbance within the next 48 hours is indicated by the color of the enclosing circle: yellow indicates a low probability of development (<30%), orange indicates medium likelihood (30-50%), and red indicates a high likelihood of development (>50%). The graphic is interactive; users can mouse over tropical cyclones or disturbances in the graphic and pop-up windows will appear with tropical cyclone advisory information or the text Outlook discussion for that disturbance. Clicking on a tropical depression, tropical storm, or hurricane symbol will take the user to a new web location that contains all advisories and products for that particular tropical cyclone.
|
|