|
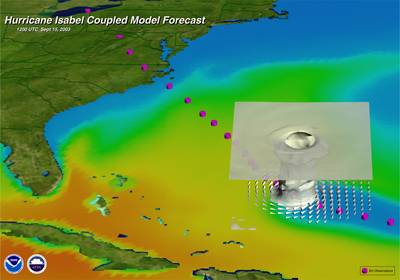
Hurricane Isabel Coupled Model Forecast
Three-dimensional view of Hurricane Isabel (2005) approaching the East Coast of the United States. Results were obtained from a 99-hour forecast made at 8:00am, September 15th using the dynamical Hurricane Prediction System developed at NOAA's Geophysical Fluid Dynamic Laboratory (GFDL). Since 1995, the GFDL model has provided forecast guidance of track and intensity for forecasters at the National Hurricane Center (NHC). The white arrows indicate wind speed and direction near the earth's surface, and the pink dots indicate observations made every 6 hours along the hurricane's track. As the hurricane's strong winds move across the ocean the cooler waters from below are brought up to the surface resulting in significant decrease in the sea surface temperature. This effect can clearly be seen in the animation, with a wake of cooler waters trailing the storm, indicated by the blue colors. Inclusion of the ocean coupling is important for the hurricane model to properly forecast the storm's intensity.
|
|