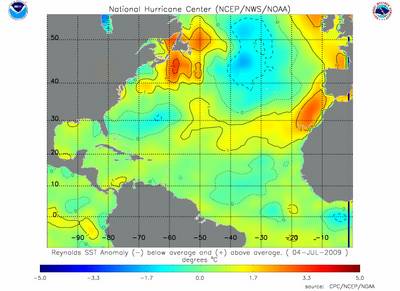
The figure shows the temperature anomalies in the North Atlantic, Caribbean Sea and Gulf of Mexico for July 4, 2009. The temperature anomaly is the difference between the temperature measured and the climatology.
NOAA/NHC
Lorem ipsum dolor
Lorem ipsum dolor sit amet, consectetur adipiscing elit. Lorem ipsum dolor sit amet, consectetur adipiscing elit. Praesent eget mauris vitae purus aliquet pretium. Nullam nibh neque, consectetur vel, iaculis vitae, volutpat et, mi. Aliquam vel justo id purus facilisis ultricies. Nulla facilisi.