|
Storm surge model Pinellas County Florida
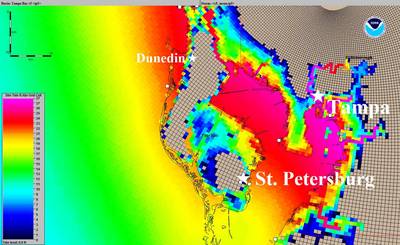
Category 5 Maximum of Maximum (MOM) for Pinellas County Florida (elevation in feet above land). Black lines indicate the shorelines as well as the grid cells for the model. Colored areas show the maximum water depth at each grid cell caused by a "family" of Category 5 hurricanes. Some inland areas (yellow color) are predicted to be inundated by 18-19 ft of water, while other areas (with light blue colors) will have 9-10 ft of inundation. Darker blue colors indicate only 1-3 ft of inundation, where empty, tan-colored grid cells indicate areas where no inundation is computed to occur. With this MOM, St. Petersburg actually becomes two islands (one with one grid cell) in a worst-case scenario Category 5 hurricane. Coastal areas outside of Tampa, FL are predicted to experience 20-25ft inundation levels (red-pink colors) in a worst-case scenario Category 5 hurricane (note, this would significantly affect Tampa International Airport and major port operations in that area). Similar MOMs (with lower inundation elevations) exist for Category 1-4 hurricanes. Emergency management officials in coastal states/counties use the MOMs to prepare for hurricane evacuations. Category 1 MOMs are also used by the State of Florida for delineation of "Coastal High Hazard Areas", which is different from that defined by the "V Zone" on FIRM maps.
|
|