Follow this link to skip to the main content
Hurricanes: Science and Society
Gallery
The top schematics show horizontal maps of the surface temperature and wind fields associated with a tropical cyclone (left) and an extratropical cyclone (right). Colors indicate temperature (blue: 15°C=59°F, blue-green: 20°C=68°F, green: 25°C=77°F). Solid lines indicate surface wind speeds (34 kt=39 mph and 64 kt=74 mph). The bottom schematics show vertical maps of the pressure surfaces and circulation at the surface and tropopause.
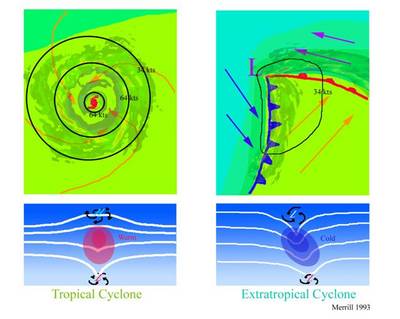
Horizontal surface temperature and wind fields
The top schematics show horizontal maps of the surface temperature and wind fields associated with a tropical cyclone (left) and an extratropical cyclone (right). Colors indicate temperature (blue: 15°C=59°F, blue-green: 20°C=68°F, green: 25°C=77°F). Solid lines indicate surface wind speeds (34 kt=39 mph and 64 kt=74 mph). The bottom schematics show vertical maps of the pressure surfaces and circulation at the surface and tropopause.
NOAA: http://www.aoml.noaa.gov/hrd/tcfaq/A7.html; Original Source: Merrill 1993