Katrina Meteorology and Forecasting |
 |
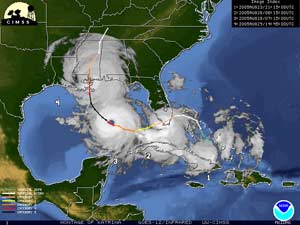 Composite image of Katrina's track and satellite images.Image courtesy CIMSS. |
Katrina formed from the interaction of a tropical wave and the remnants of a previous tropical depression. August 23, 2005 Tropical Depression Twelve formed. The depression became Katrina August 24 when it was located over the Bahamas. Katrina was the 11th tropical storm of the 2005 hurricane season. Katrina turned westward on August 25th, toward Florida. Katrina intensified before making landfall in Florida and was a hurricane about 2 hours before making landfall on the southeastern coast of Florida, near the border of Miami-Dade County and Broward County. A well-defined eye became apparent on radar imagery and remained intact all the way across Florida. Katrina only spent about 6 hours over land and was in the Gulf of Mexico early on August 26.
In the Gulf of Mexico, Katrina was located in an environment conducive to strengthening, a very low shear environment over warm water. Katrina underwent to periods of rapid intensification, between August 26 and 28. On August 27th, Katrina became a Category 3 hurricane with 185 km/hr (115 mph) winds and had a well formed eye on satellite imagery. Throughout August 27 Katrina nearly doubled in size and by the end of the day, tropical storm force winds extended about 260 km (160 miles) from the center.
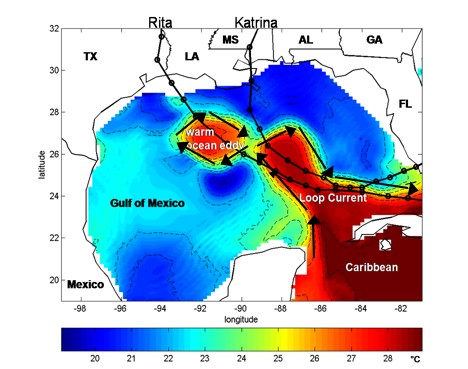 Approximate temperature in degrees Celsius of the ocean 75 m (250 ft) below the surface in September 2005, as indicated by the color scale at the bottom of the image. The Loop Current extends into the Gulf of Mexico from the Caribbean Sea and then exits the Gulf of Mexico just south Florida. To the west of the Loop Current is a warm ocean eddy. Hurricanes Katrina and Rita passed through the Gulf of Mexico in late August and September of 2005, as shown by the lines with black dots. Image adapted from Yablonsky and Ginis (2008). |
Early on August 28 Katrina underwent a second rapid intensification, strengthening from a Category 3 storm to a Category 5 storm with peak winds of 278 km/hr (172 mph). Hurricane force winds extended 167 km (104 miles) from the center and tropical storm force winds extended 370 km (230 miles) from the center. One reason for Katrina’s rapid development was the path Katrina took over the Loop Current, which provided deep warm water.
The strong middle to upper-trophospheric ridge that had been guiding Katrina westward shifted to the east, turning Katrina northwest on August 29, toward Mississippi and Louisiana. Katrina began weakening before landfall but remained a large storm. Katrina made landfall first in Buras Louisiana at around 4am local time as a strong Category 3 Hurricane with 204 km/hr (127 mph) winds. Katrina made a final landfall near the mouth of the Pearl River at the Louisiana-Mississippi border. Katrina weakened rapidly while moving inland becoming a Category 1 Hurricane by 1pm local time and a tropical storm at 7pm local time on August 29. While Katrina had a low central pressure at landfall (920 mb) the winds were not as strong as might be expected from such a low pressure as Katrina’s wind field broadened as it approached land, resulting in lower than expected winds at the surface.
However, Katrina’s biggest impact was with storm surge and water. Due to the large size of the storm, there was a large wind field with maximum winds likely extending up to 55km (35 m ) from the center. The storm surge along the Mississippi coast was between 24 and 28 ft. along a 20 mile wide section of shoreline centered on St. Louis Bay. The storm surge was 17 to 22 ft. from Gulfport to Pascagoula Mississippi. The surge went as far inland as 6 miles from the coast and 12 miles at bays and rivers. The Alabama coastline also experienced an 8 to 12 ft. surge. Storm surge in Lake Pontchartain were 12 to 16 feet on the northeast shore, 15 to 19 ft. in eastern New Orleans, and 10 to 14 ft. on the southern shore. Additionally, 8-10 inches of rain or more fell across large parts of Mississippi and Louisiana along and to the west of the track.
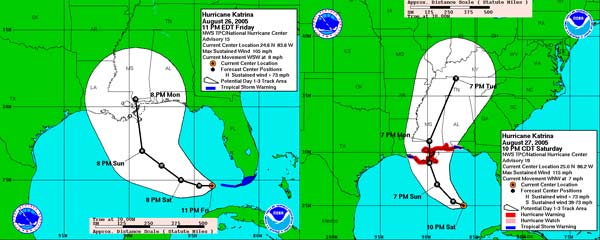 Two NHC forecast graphics showing the forecast track toward the Louisiana Mississippi border from 11pm Friday August 26 and 10pm Saturday August 27. Image from NOAA National Hurricane Center. |
|
The official forecast track errors for Katrina were considerably less than the average NHC official track error for the Atlantic Basin. Some of the forecast models did an excellent job modeling Katrina. The high quality of the models were part of the reason the forecast in the 2.5 days before landfall were remarkably consistent and accurate. About 24 hours before landfall the NHC advisories included information about storm surge, estimating 18-22f. locally and up to 28 ft. in some places.
|

