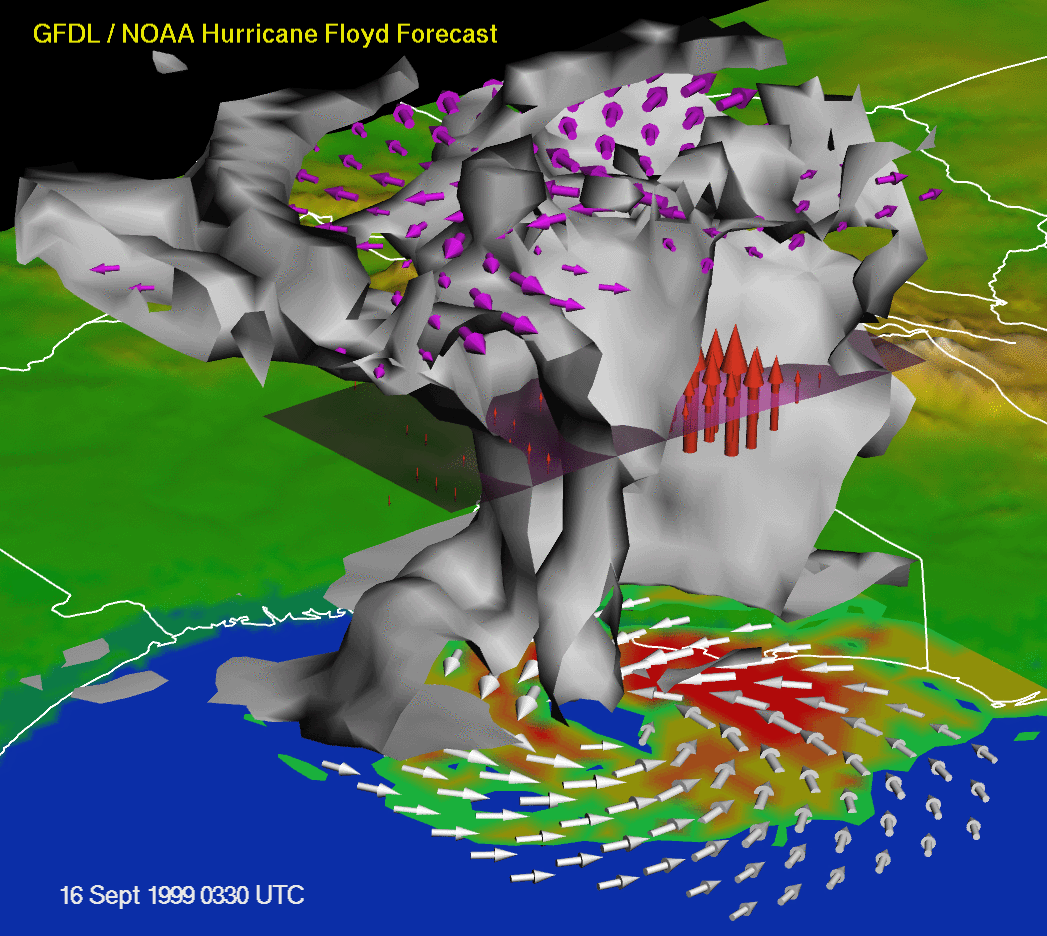
Three-dimensional view of Hurricane Floyd as it approached landfall at Cape Fear on September 16, 1999. Results were obtained from a forecast made using the dynamical Hurricane Prediction System developed at NOAA's Geophysical Fluid Dynamic Laboratory (GFDL). The model correctly forecast the path of Floyd up the East Coast of the United States. In the figure, winds in excess of gale force are indicated by the magenta and white arrows at the surface and top of the storm, respectively. The color shading at the earth's surface represents the
precipitation, with red indicating higher intensities. The gray three-dimensional "cloud-like"? feature is the 80%
relative humidity surface, cut away on its eastern side to reveal the hurricane's interior structure, including the tube-like eye down the center. The horizontal plane slicing through the middle of the storm, and the red vertical arrows, indicate the upward motion in the storm's interior. Note the north-south asymmetry of the storm, as Floyd gets swept up in the larger-scale southwesterly flow. Image credit: NOAA/GFDL.


