
Storm surge models are a useful scientific tool for predicting real-time storm surge and future planning. These models provide real-time forecasting of the water level and potential inundation under storm conditions. Storm surge models are also used to hindcast the flooding generated by past hurricanes, assess future flood risks, and produce potential flooding maps for planning purposes.
Although there are differences between every storm surge model, they all share a common set of required data to generate storm surge simulations. A basic recipe for running a storm surge model to generate wind-driven storm surge includes:
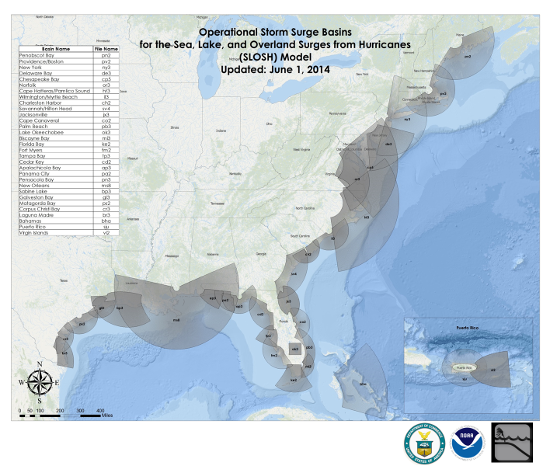
Most storm surge models are two-dimensional, meaning that the current variation with depth is not resolved in these models. Researchers have shown that a well-tuned two-dimensional model is sufficient to produce an accurate estimate of the abnormal rise in water level due to storms. However, for some applications such as pollutant transport, a three-dimensional model is necessary for accurate results. Commonly Used Storm Surge Models Some well-developed storm surge models used in the U.S. include the SLOSH model (the Sea, Lake, and Overland Surges from Hurricanes); the ADvanced CIRCulation (ADCIRC) coastal circulation and storm surge model; and (CH3D)-SMSS, the Storm Surge Modeling System with Curvilinear-grid Hydrodynamics in 3D. Storm surge models developed or used in other countries include Delft3D (Netherlands) and the Japan Meteorological Agency (JMA) storm surge model. The SLOSH model was developed by the National Weather Service (NWS) in the 1990s (Jelesnianski et al. 1992, Glahn et al. 2009 ) and is still the operational model used by National Hurricane Center (NHC) due to its computational efficiency. The SLOSH model separates the coastline into 32 basins which cover the entire U.S. Atlantic and Gulf of Mexico coastlines as well as Hawaii, Puerto Rico, Virgin Islands, and the Bahamas. These model basins are centered particularly susceptible features, such as inlets, large coastal centers of population, low-lying topography, and ports. Each basin is represented by a mesh or grid (see Research Models - http://www.hurricanescience.org/science/forecast/researchmodels/) which can resolve ocean bathymetry and land features in great detail, but does not extend to the open ocean.
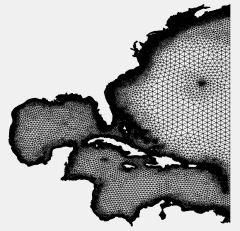
The Advanced Circulation (ADCIRC) model was developed at the University of North Carolina by Dr. Rick Luettich. It is a more complex and capable and more time-consuming storm surge model than the SLOSH model. ADCIRC makes use of a highly flexible mesh system to produce storm surge simulation. The model can better simulate tides propagated from the open ocean and is also capable of resolving very detailed bathymetry in the coastal region. After Hurricane Katrina, the Interagency Performance Evaluation Taskforce (IPET) used the primarily a two-dimensional ADCIRC model to simulate Katrina’s storm surge and produce coastal flood maps for a storm with a 1% and 0.2% annual chance of occurrence in a given year for the New Orleans region. ADCIRC is also being used by the U.S. Federal Emergency Management Association (FEMA) to produce Flood Insurance Rate Maps (FIRMs) in several coastal regions. A storm surge and wave guidance system is being developed based on the ADCIRC model that can be used for coastal emergency risk assessment (https://cera.coastalrisk.live).
Differences between surge models: SLOSH and ADCIRC
The two models are computed on different mesh system. SLOSH utilizes a curvilinear grid system, which is by default a structured grid because there is a fixed relationship between grid points. The spatial resolution in the curvilinear grid can vary a little bit with latitude, but not drastically. In contrast, ADCIRC implements its computation on an unstructured grid system, which can be concentrated near the coast for higher resolution at the coast. Due to major differences in the mesh system, the mathematical methods used to solve the physical equations computationally in the models are also different (explained in the table above). However, the method used in SLOSH is not superior to the other one. Both of them can produce optimized results with their associated grid systems. The physics that is included in the model are different. In SLOSH, the ocean surface wave component of storm surge is not included. However, the ADCIRC model is bundled (coupled) with a wave model called SWAN (Simulating WAves Nearshore) to include the ocean surface wave component in the surge. Through the comparisons above, it is evident that the ADCIRC model is more complicated than the SLOSH model. Hence, it is not a surprise that running the ADCIRC model require a lot more computational resources and time than running the SLOSH model. In terms of performance, it is hard to say which model is better because parameters can always be tuned differently to produce accurate simulations. However, the less complex SLOSH model, tuned to run in operational mode, can perform badly under some unusual hurricane cases. For example, when the storm size (defined by the radius of gale-force wind (~17m/s)) is large and the hurricane moves slowly, water will be transported from the open ocean and the so-called forerunner surge due to the Coriolis force (basically the earth rotation) can be generated hours prior to the hurricane landfall. In this case, the ADCIRC model can do a better job than SLOSH mainly because of a larger computational domain size. Hurricane Ike in 2008 is a good example. Ike’s wind field was among the largest observed for a landfalling hurricane in the Atlantic over the past 30 years. (For more details of the forerunner surge in Ike, see Kennedy et al. 2011.) Discrepancies between the SLOSH model and the observations are reported to be significant. (see comments in https://texas.resiliencesystem.org/fr/comment/1325#comment-1325) The highest recorded surge is 22 feet coming ashore at Sabine Pass, which almost doubles the SLOSH prediction. The SLOSH model is still the model used for real-time forecasting because the forecast has to be made in a short time period (a few hours); and the SLOSH model output is accurate enough, in most conditions, for decision making as a storm approaches. Care needs to be taken when the hurricanes share characteristics similar to Hurricane Ike (2008). Accuracy of storm surge models The errors in a storm surge model mainly come from three aspects. Most errors can be attributed to the quality of the input data, for example, model forcing such as storm track, wind intensity, etc., as well as bathymetry and topography data. Model physics is also important especially in the parameterization of physical processes (e.g., wind stress, surge-wave interaction, interaction with topographic features). Models running in 2D or 3D mode can be considered as part of the model physics, because it mainly affects the simulation of the bottom friction. The last factor is model domain and grid resolutions, which stem from the numerical approximations used in the model. Usually, higher spatial resolutions give higher accuracy if the model physics are complete and the input data are high quality. The SLOSH model is generally accurate within plus or minus 20 percent given a perfect track, intensity, and size of the hurricane. For example, if the model calculates a peak 3 m (~10 ft) storm surge for the event, one can expect the observed peak to range from about 2.4-3.6 m (~8 -12 ft). Types of surge model predictions With surge models, there are three different types of predictions that can be made. Each type has its own strengths and weaknesses and may serve a different purpose. Deterministic prediction Probabilistic Prediction Composite/Ensemble Prediction Probabilistic prediction and composite/ensemble prediction are the model outputs that the public and emergency managers use. The deterministic approach is more commonly used for research (model improvement) and past storm analysis. References NOAA/NHC, “Sea, Lake, and Overland Surges from Hurricanes (SLOSH)” https://www.nhc.noaa.gov/surge/slosh.php Resio, D.T. & Westerink, J.J., 2008. Modeling the physics of storm surges. Physics Today Glahn et al. 2009, the role of the slosh model in national weather service storm surge forecasting Kennedy, A. B., Gravois, U., Zachry, B. C., Westerink, J. J., Hope, M. E., Dietrich, J. C., … Dean, R. G. (2011). Origin of the Hurricane Ike forerunner surge. Geophysical Research Letters, 38(8), n/a-n/a. http://doi.org/10.1029/2011GL047090 National Research Council. 2003. Fair Weather: Effective Partnership in Weather and Climate Services. Washington, DC: The National Academies Press. https://doi.org/10.17226/10610. Committee on FEMA Flood Maps, Board on Earth Sciences and Resources/Mapping Science Committee, National Research Council (NRC), 2009, "Mapping the Zone: Improving Flood Map Accuracy." http://www.nap.edu/catalog.php?record_id=12573 Jeffrey Masters, Ph.D., "Storm Surge Inundation Maps for the U.S. Coast." Weather Underground. http://www.wunderground.com/hurricane/surge_images.asp NOAA, "Hurricane Preparedness- SLOSH Model." http://www.nhc.noaa.gov/HAW2/english/surge/slosh.shtml NOAA/NHC, "Storm Surge Overview." http://www.nhc.noaa.gov/ssurge/ssurge_overview.shtml |
 |
Please address comments and questions to hurricane@etal.uri.edu