
Long-term variations in hurricane activity due to climate change are distinct from short-term year-to-year variations in hurricane activity or changes in hurricane activity during a given hurricane season, both of which are discussed in Variability of Hurricane Activity. It is important to note, however, that, owing to difficulties in measuring hurricanes, separating the effects of anthropogenically-influenced climate change from natural variability on hurricane activity is very difficult, and at present, it remains uncertain whether past changes in hurricane activity have exceeded the variability from natural causes. Consensus statements on the potential link between hurricanes and climate change can be found within the Intergovernmental Panel on Climate Change (IPCC) Fourth Assessment Report and in a recent assessment produced by a World Meteorological Organization (WMO) expert team on climate change impacts on tropical cyclones (Knutson et al. 2010; http://www.nature.com/ngeo/journal/v3/n3/abs/ngeo779.html).
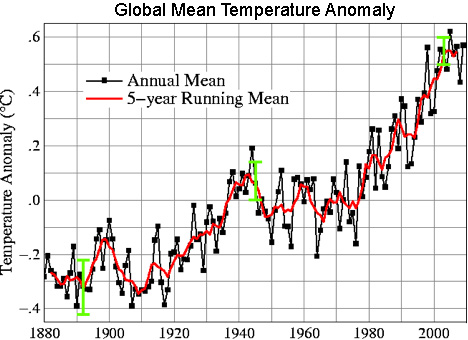
Climate change may affect hurricane intensity, frequency, track, size, and/or rainfall. As discussed in Hurricane Development: From Birth to Maturity, hurricanes require warm sea surface temperatures (SST) to develop and to be maintained. As the global climate warms, primarily due to increasing greenhouse gases (e.g., Fig. 2), the sea surface temperature also increases in the tropical oceans where hurricanes form. In theory, hurricanes may then become more intense or better able to survive at a high intensity for longer periods of time.
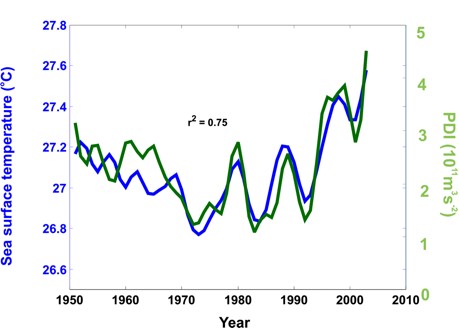
Figure 3 above shows that sea surface temperature in the tropical Atlantic and an integrated measure of Atlantic hurricane activity since 1950 are very well correlated on time scales of a few years of more. A crucial question for the science of climate change and hurricanes is whether the statistical relationship shown in the figure will also apply for future greenhouse warming in the tropical Atlantic. Projections will be discussed in a later section below.
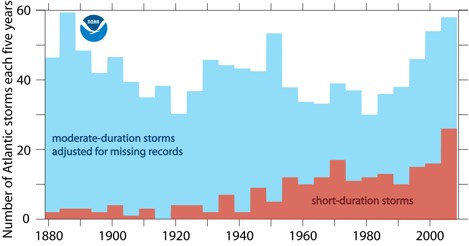
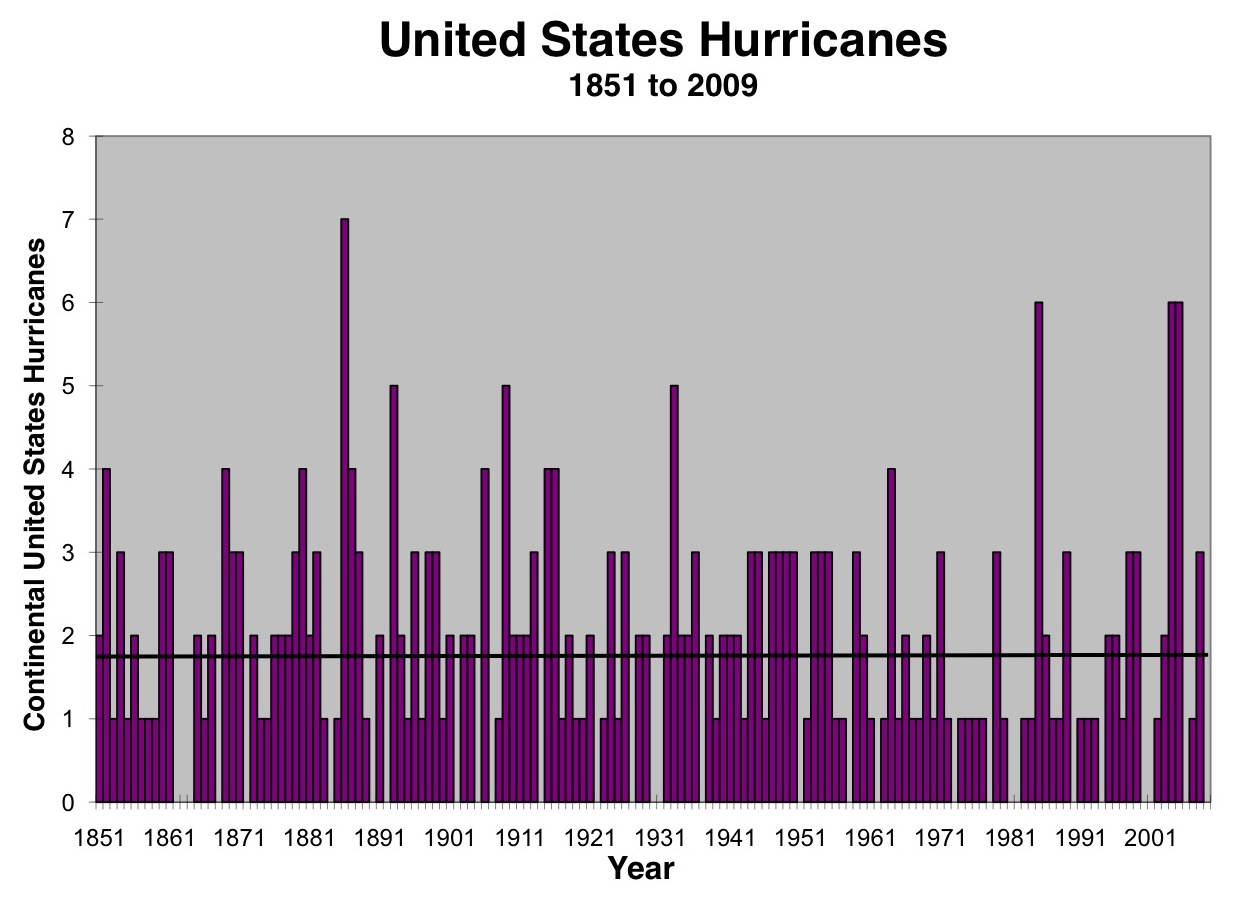
The official North Atlantic hurricane season begins in June, peaks in early September, and then ends in November (see Variability of Hurricane Activity). Although tropical systems have formed outside this period, a majority of tropical storms form within these months. Due to recent increases in hurricane activity, and especially a recent increase in early-and late-season activity, questions are also being raised about the possible effect of climate change on the length of the hurricane season. In terms of the Atlantic tropical storm and hurricane count record going back to 1878, a recent study found that existing upward trends in the data series are due almost entirely to an increase in short-lived (<2 day) systems alone (Fig. 4), which the scientists conclude was most likely an artifact of improvements over time in observing capabilities. Examining the moderate-duration (> 2 day) systems, they found no significant increasing trend, and even the small trend they found was completely removed when a further adjustment was made in an attempt to account for the limited number of ships in the open Atlantic during the pre-satellite (pre-1965) part of the record. Determining the causes of observed long-term hurricane activity changes is a daunting challenge. This issue is complicated by the fact that the existing record of Atlantic hurricane activity, while extending back to the mid-1800’s in the Atlantic (and not nearly as far back in other ocean basins), is of uneven quality. Satellite-based monitoring, which allows for markedly improved basin-wide coverage, only extends back to the 1960’s, when satellites were launched that could monitor hurricanes [link to observation section]. Signatures of hurricanes that made landfall prior to the mid-1800’s are sometimes inferred using geological evidence such as storm overwash deposits in near-coastal lakes. One record of hurricane activity that has somewhat more reliability is the number of hurricanes striking the United States going back into the 19th Century. This shows quite pronounced year-to-year variations with as many as 7 hurricane strikes in 1886 and 6 in both 2004 and 2005 and as few as none occurring many years, the most recent being 2009. No significant long term up or down trend is apparent in this record.
In summary, scientists are still “uncertain whether past changes in tropical cyclone activity (frequency, intensity, rainfall, and so on) exceed the variability expected through natural causes, after accounting for changes over time in observing capabilities” (Knutson et al., 2010). |
 |
Please address comments and questions to hurricane@etal.uri.edu