
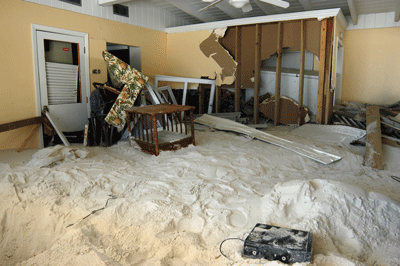
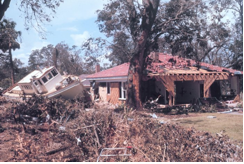
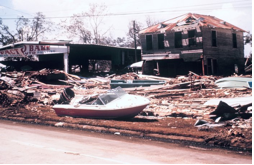
The coastal flooding triggered by hurricanes is as destructive as wind but can be even more deadly, and is by far the greatest threat to life and property along the coastline. Storm surge, wave, and tides are the greatest contributors to coastal flooding, while precipitation and river flow also contribute during some storms. Hurricane Katrina (2005) is a prime example of the damage and devastation that can be caused by surge: at least 1600 fatalities stemmed from Katrina and many of those deaths occurred directly, or indirectly, as a result of storm surge.
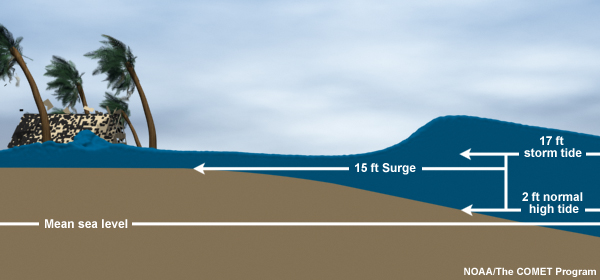
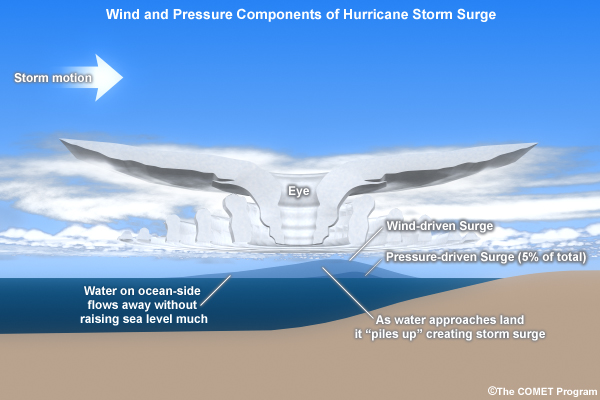
Storm surge is the bulge of water that washes onto shore during a storm, measured as the difference between the height of the storm tide and the predicted astronomical tide. It is driven by wind and the inverse barometric effect of low atmospheric pressure, and is influenced by waves, tides, and uneven bathymetric and topographic surfaces. The storm tide, which includes storm surge and the astronomical tide, is shown below.
Storm surge and coastal flooding depend on a number of factors. These factors include the intensity of a storm, its size, translational speed, angle of approach to the coast, landfall location, and the bottom slope at that location. It is well accepted that the most influential factor in storm surge generation is the central pressure deficit, which controls the intensity of a hurricane, i.e., wind velocity and stress over the ocean surface and inverse barometric effects. The influence of the other factors, such as the storm size (measured by the radius from the center of a hurricane to the location of maximum wind speed), the translational speed, and the angle of approach, became apparent after Hurricane Katrina's catastrophic storm surge in 2005 (Hurricane Katrina was a Category 3 storm). Lower atmospheric pressure (faster wind speeds) and larger storms create a greater storm surge potential. Slower and larger but weaker hurricanes (e.g., Category 3 storms such as Katrina) cause much higher storm surge and flooding (even to inland areas) when compared to faster and small but more intense hurricanes (e.g., Hurricane Charley in 2004). Storms that make a perpendicular approach toward the coastline will also cause a greater storm surge, whereas those that travel parallel to the coastline will have a reduced storm surge.
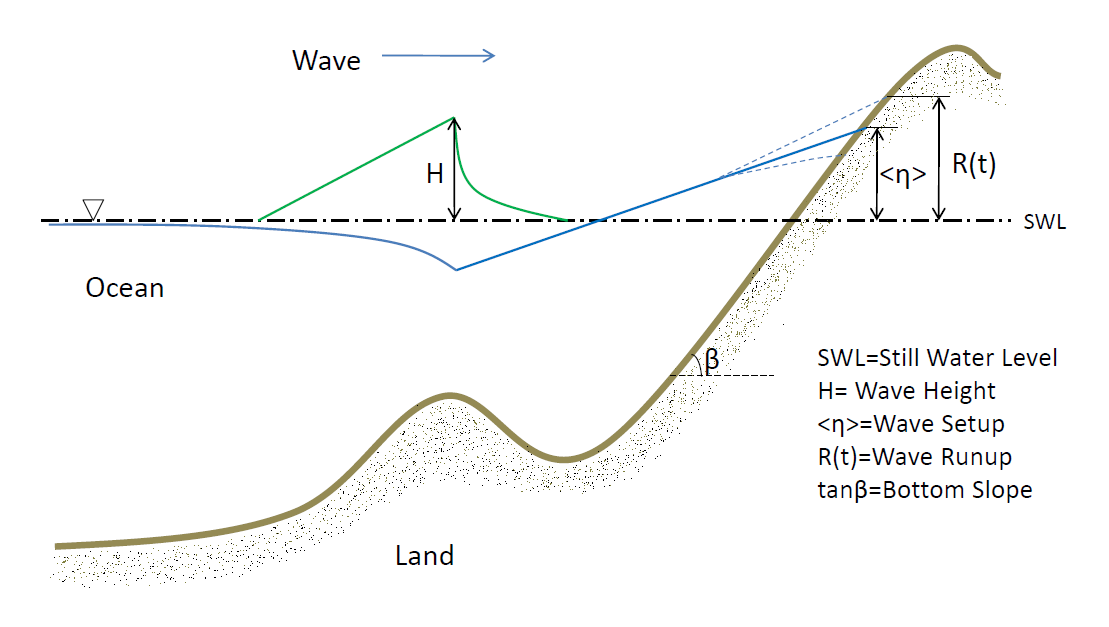
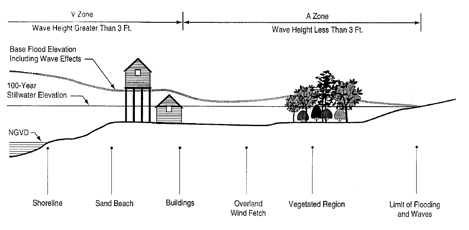
Bathymetry and topography changes often occur as a result of storms and erosion, and also vary geographically. These geographic differences affect Base Flood Elevations (BFEs) and resultant coastal responses and flood hazard areas. For example, the Pacific coast is characterized by steep bathymetry and a narrow coastal shelf, and flooding is predominantly caused by large waves rushing up the shore (wave runup - the maximum extent of high-velocity uprush of individual waves above the average water level). In contrast, the Gulf and Atlantic coasts are characterized by wide, shallow coastal shelves, and flooding is dominated by storm surge and breaking waves. Water surface elevations at the shoreline are a combination of the average water level determined by wind setup (due to the direct action of wind stresses at the air-sea interface) and wave setup (due to breaking waves, see below), and a fluctuating water level caused by wave runup.
Storm surge and coastal flooding have both vertical and horizontal dimensions. Storm surge can reach heights of more than 12 m (40 ft) near the center of a Category 5 hurricane, and fan out across several hundred miles of coastline, gradually diminishing away from the hurricane’s center. Coastal flooding can reach far inland, tens of miles from the shoreline. While the peak surge often occurs at the landfall of a storm along an open coastline, large surge has been found to occur hours before hurricane landfall as a “fore-runner” (e.g., during Hurricane Ike along the Texas coast in 2008) and/or after hurricane landfall as a “post-runner” (e.g, during Hurricane Wilma along SW Florida coast in 2005). These “fore-runner” and “post-runner” surges can actually cause unexpected coastal flooding, damage property, and endanger lives. Local topographic features such as buildings, levees, wetlands, sand dunes, and barrier islands reduce storm surge, wave forces, and coastal flooding. At the same time, these topographic features may be reshaped or even removed during a severe storm (see Ecosystem Perspective: What can a hurricane do to the environment?. After the landfall and passage of Hurricane Katrina (2005), levees in New Orleans breached and catastrophic flooding followed shortly afterwards. Storm surge, wave, and coastal flooding are also complicated by the presence of estuaries. For example, a long and narrow estuary can significantly increase the storm surge due to a “funneling” effect. Storm surge can travel from the mouth to the head of an estuary, causing a delayed peak surge in that location when winds have already subsided. Diverse geographic variations in local bathymetry and topography result in very different responses of coastal regions to hurricanes. Hence, it is difficult to assign a uniform storm surge value for a hurricane of any given intensity. Due to this, the Saffir-Simpson Wind Scale no longer associates storm surge value to hurricane of any category.
The combination of storm surge, battering waves, and high winds can be deadly. In the United States, the Atlantic and Gulf Coast coastlines are densely populated and many regions lie less than 3m (10 ft) above mean sea level. In August 1969, Hurricane Camille, the second most intense hurricane on record to hit the United States, produced a storm tide of 7.5 m (24.6 ft) at Pass Christian, MS. The combination of Camille’s winds, surges, and rainfall caused 256 deaths (143 on the Gulf Coast and 113 in the Virginia floods) and $1.421 billion in damage.
In 2005, Hurricane Katrina impacted the same region of the Mississippi coast. Although Katrina was a Category 3 hurricane with 209 km/h (130 mph) sustained winds (Camille was a Category 5 hurricane with 306 km/h [190 mph] sustained winds), Katrina's storm surge exceeded Camille's at all locations, topping out at 8.5 m (27.8 ft) at Pass Christian, MS. Even though Camille was a much more intense hurricane, Katrina was a much larger storm, causing a higher storm surge that also covered a much larger area. Hurricane Camille was a small storm with a very tight eye, and, at landfall, hurricane-force winds only extended about 97 km (60 mi) to the east of the storm’s center. Camille had an 18 km (11 mi) diameter eye and a radius of maximum winds of approximately 24 km (15 mi). In contrast, Hurricane Katrina, had a large, 60 km (37 mi) diameter eye, and hurricane-force winds extended out about 193 km (120 mi) to the east of the storm’s center. Katrina's radius of maximum winds was about 48 km (30 mi), double that of Hurricane Camille. Katrina therefore set in motion a volume of water about four times greater than Camille, a U.S.-record storm surge that impacted a wide region from Grand Isle, LA, to Mobile Bay, AL, and killed over 1300 people. Observation of Storm Surge, Wave, and Flooding
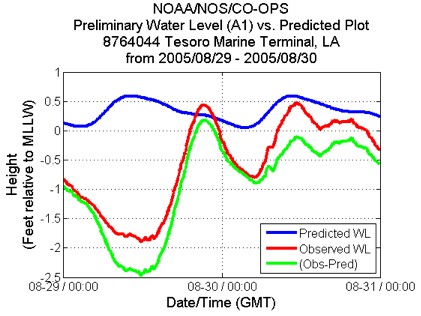
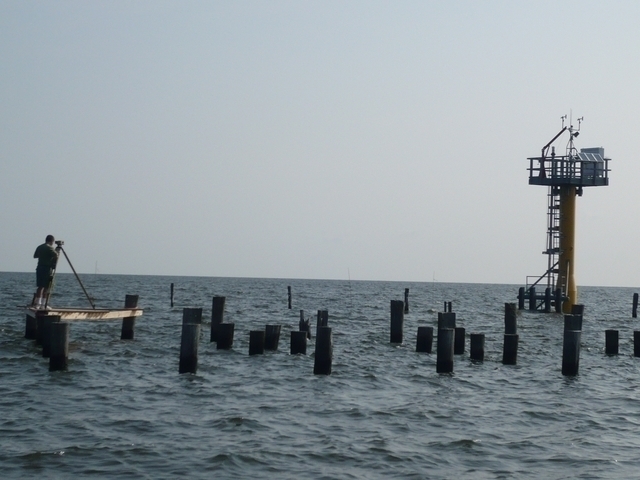
Observation data of storm surge, wave, and coastal flooding are needed for scientific understanding of the dynamics of surge, wave, and flooding, as well as for verification of numerical models. Observation of storm surge relies on sparsely located tidal gages installed by NOAA and other agencies along the coastline. The continuously observed data at a tidal gage gives the total water elevation relative to a vertical datum (e.g., NAVD88 or NGVD25). The observed water elevation consists of storm surge, tide, and wave setup. While the tide contained in the data can be removed by applying a 32-hour filter to the data or by subtracting the NOAA-predicted tide at that location to give the storm surge value (see an example below), it is difficult to isolate the wave setup from the remaining data signal. The only way to determine the wave setup is by simulation of surge and wave during hurricanes, and comparison of simulated surge and wave with data.
Observation of coastal flooding is based on the so-called High Water Marks (HWMs) in flooded area during a hurricane. These HWMs, which supposedly record the highest water level during a hurricane, are often difficult to interpret due to the following problems: 1) it is difficult to know if waves are included in the HWMs; 2) the vertical datum of the HWMs is often missing; 3) the HWMs are often observed at locations near a major river; and 4) the HWMs only provide peak water elevation, without any information on when the peak occurred. For hurricanes prior to Katrina, only limited tidal gage data and HMWs are available. Since Hurricane Katrina, the United States Geological Service (USGS) has deployed arrays of more than 40 pressure sensors in upland areas during hurricanes to measure the continuous coastal flooding data over a large upland area. These data during recent hurricanes (e.g., Rita, Wilma, and Ike) have been found to be very valuable in understanding and quantifying the dynamics of coastal flooding. They provide the time history and spatial extent of coastal flooding, which cannot be provided by conventional tidal gages in water.
|
 |
Please address comments and questions to hurricane@etal.uri.edu