
Storm surge and inundation can have catastrophic results on the coastal zone. To relay the danger of this threat two main products are currently used: Maximum of Maximum (MOM) maps and Flood Insurance Rate Maps (FIRMs), which are provided for all coastal domains/basins by the National Hurricane Center (NHC) and the U.S. Federal Emergency Management Agency (FEMA), respectively. Coastal communities and emergency managers use MOMs and FIRMs for planning, preparation, response, and mitigation of coastal flooding caused by hurricanes.
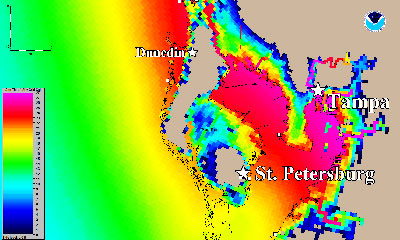
MOM maps are a composite of a large number of NHC SLOSH (Sea, Lake, and Overland Surges by Hurricanes) model runs. Currently the NHC creates MOMs by storm category (e.g. Category 1 Hurricane, Category 2 Hurricane, etc.). For a given storm category about 2,000 to 4,000 simulations are run for each coastal area. A Maximum Envelope of Water (MEOW), which represents the composite maximum inundation level at each model grid cell, is produced by running the SLOSH model for a family of hurricanes (typically 200-400) with the same intensity in the Saffir-Simpson Hurricane Wind Scale, size, direction, and speed. A MOM map is the composite of the individual MEOWs and depicts the worst-case flooding scenario for that area caused by hurricanes of a particular category in the Saffir-Simpson Hurricane Wind Scale. An example of a Category-5 MOM, which shows the Maximum of Maximum inundation caused by Category-5 hurricanes for Pinellas County, the largest and richest coastal county in Florida, is shown to the left. To identify a community’s flood risk, FEMA conducts a Flood Insurance Study (FIS) every few years. The study includes statistical data for river flow, storm tides, hydrologic/hydraulic analyses, hurricane storm surge modeling, and rainfall and topographic surveys. FEMA uses this data to create Flood Insurance Maps (FIRMs), which show floodplain boundaries that indicate different flooding probabilities. FIRMs are based on the results of hundreds of model runs using storm surge model and an ensemble of storms, which are determined using the Joint Probability Method (JPM). The JPM makes use of available historical hurricane data (including intensity, size, direction, forward speed, and landfall point for the coastal region) and then determines an ensemble of hypothetical storms that represent the statistics of the historical storms. These hypothetical storms are then used by a storm surge model to calculate the coastal inundation that is likely to take place with a 1% chance of annual occurrence. When a very large number of hurricanes are used for model runs, the ensemble of hurricanes becomes similar to that used by the SLOSH runs that the NHC uses to produce a MOM map (as discussed above). Since the JPM considers the probability of occurrence of each of the observed hurricane characteristics, each of the storms in the ensemble is assigned a probability of occurrence, and results of the storm surge runs are used to define a distribution of Base Flood Elevations (BFEs). This BFE distribution is then used by FEMA’s National Flood Insurance Program (NFIP) to define flood zones and create FIRMs.
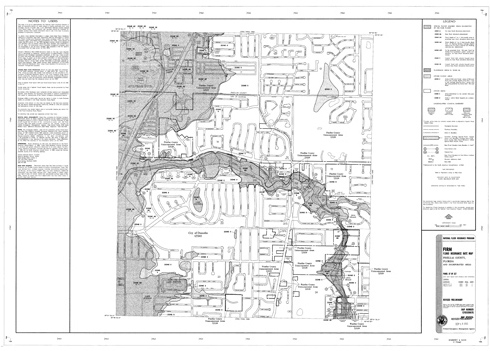
Floodplains and areas subject to coastal storm surge are considered high-risk areas, or Special Flood Hazard Areas (SFHAs) and are shown on the FIRMs as zones labeled with the letters V, VE, V1-30, VO, AR/A, AR/AH, AR/AO, AR/AE, AR/A1-30, AR, A99, AE, A1-30, AH, AO, and A. These high-risk areas have a 1% or greater chance of flooding in any given year (this area is also referred to by some as the 1% annual-chance floodplain, base floodplain, or the 100-year floodplain). Please note, areas directly outside of these high-risk areas may also find themselves at considerable risk. V-zones occur along the water’s edge in the coastal zone, an area that is subject to damage from both inundation and wave heights greater than about 1 m (~ 3 ft). V-zones on a FIRM are considered to be the coastal high hazard areas by FEMA. A-zones usually occur further inland and are subject to damage from inundation and waves of less than 1 m (~ 3 ft). An example of a FIRM for Pinellas County (the same area that was depicted in the MOM map above) is shown to the right. While this map shows the various flood zones, it does not display the BFE values. For BFE values, one can download the FIRMs for numerous panels in the Pinellas County. If one utilizes tools available in FEMA’s Map Service Center to identify specific panel numbers, a request can be made to FEMA to obtain free maps in pdf. Also, for a tutorial on how to read a FIRM map, please go here. FEMA has published almost 100,000 individual FIRMs to enable individuals to make informed decisions about protecting property, both financially and structurally. FEMA is also working on a regular basis to update flood maps to provide homeowners with the most reliable information available about flood risk. Although paper FIRMs may be obtained free from FEMA, the agency has recently developed the Digital Flood Insurance Rate Maps (DFIRM) database designed for use with digital mapping and analysis software. DFIRM Databases have been completed for a number of communities and counties. The Standard DFIRM Database is designed to provide the user with the ability to determine the flood zone, BFE, and the floodway status for a particular location. It also has National Flood Insurance Program (NFIP) community information, map panel information, cross section and hydraulic structure information, Coastal Barrier Resource System information (CBRS, if applicable), and base map information like road, stream, and public land survey data. More details on the DFIRM Database and a detailed database specification for the product are available through FEMA’s Map Service Center One can also easily determine the risk of flooding at their home or place of business by using the One-Step Flood Risk Profile Tool located at www.FloodSmart.gov, the official website of the National Flood Insurance Program. To learn more about a home’s vulnerability to hurricanes or other threats based on its location, contact your state’s emergency management agency.
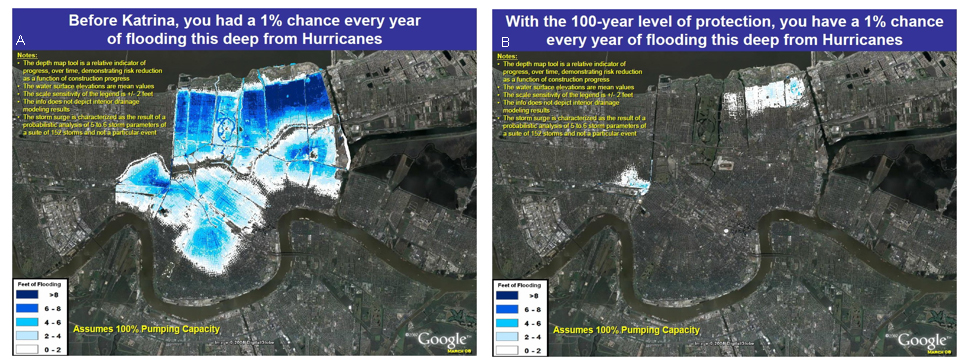
While both MOM and FIRM maps provide a good baseline for relaying the coastal flooding threat, both products can be improved. A MOM does not inform a user of the probability associated with the occurrence of inundation level at any location, and usually does not include the effects of all the relevant physical processes associated with storm surge such as waves, tides, precipitation, and river discharge. The simulations used to generate FIRM maps do include wave effects, but the modeling approach for generating BFEs needs improvement. Since Hurricane Katrina (2005), several modern storm surge and inundation models, which include more robust physics and higher model resolution, have been developed. Some of these models, including ADCIRC (ADvanced CIRCulation model, Luettich et al., 1992), CH3D-SSMS (Curvilinear-grid Hydrodynamics in 3D – Storm Surge Modeling System, Sheng et al., 2010a and b), CMEPS (Based on the Princeton Ocean Model, Peng et al., 2004), and FVCOM (Finite Volume Coastal Ocean Model, Chen et al., 2008) are being compared, in terms of historical hurricane simulations and coastal inundation maps, in a Regional Storm Surge and Coastal Inundation Model Testbed. Preliminary results of the Testbed indicate that the accuracy of calculated storm surge and coastal inundation is very sensitive to the input data (topography, bathymetry, and wind field) and model features (processes included, model parameterization and coefficients, and model grid resolution, etc.). Even when the same input data and model coefficients are used, different models can yield noticeably different inundation maps. Skill assessment of storm surge models is needed to ensure and improve the quality and accuracy of the inundation maps (MOMs and FIRMs) produced. Although there are a number of products available to relay the threat of coastal flooding from hurricanes, all are based on current (and past) climate and sea level conditions. It is important to understand that these maps have not yet had current sea level rise information integrated. Future effects of climate change on hurricane intensity/frequency and sea level rise should be included in future coastal inundation maps for more effective planning, response, preparation, and mitigation of inundation hazard. In addition, a real-time coastal inundation forecasting system can be developed to provide timely inundation forecasts to enable more effective planning and response. As part of the examination of post- Hurricane Katrina hazards, the United States Army Corps of Engineers (USACE) recently published maps showing the depth of inundation for different flood scenarios in the New Orleans, LA, area. Because these maps were developed incorporating the probability of a flood event, the probability that the flood protection system will perform as designed, the probabilities of overtopping or failure of the structures, and the consequence of the flood event (inundation), these products are true risk maps rather than hazard maps.
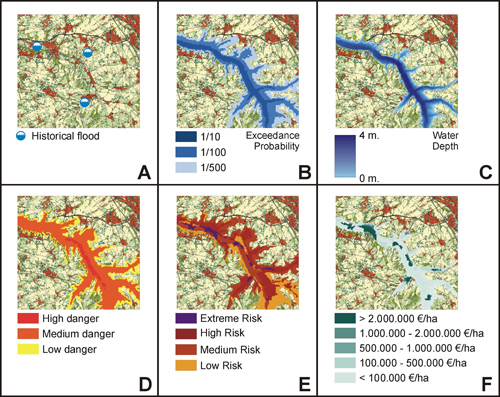
Flood insurance rate zones (A- and V-zones) are a primary way to communicate flood hazard because areas known or suspected to be subject to flood damage have higher insurance premiums. Flood insurance is generally required for any home that is within a 100-year flood zone. There is growing concern that over reliance on the 100-year flood map gives people living outside of this zone a false sense of security and that they are not in danger of flooding. During Tropical Storm Allison (2001) and Hurricane Ivan (2004), massive flooding damage occurred outside the 100-year flood zone, as determined by FEMA maps. Similarly, Hurricane Ike’s (2008) storm surge caused billions of dollars in flood loss in properties outside the 100-year flood zone. Recently, the U.S. National Academies convened a study to assess and improve the accuracy of FEMA flood maps, upon request by managers of FEMA’s Risk Analysis Division and the National Oceanic and Atmospheric Administration’s (NOAA’s) Coastal Ser¬vices Center. The Committee on FEMA Flood Maps was established to examine the factors that affect flood map accuracy, assess the economic benefits of more accurate flood maps, and identify ways to improve flood mapping, communication, and man¬agement of flood-related data. Committee members included academics and practitioners who collectively possessed expertise covering inland and coastal flood modeling and mapping, geospatial data management, flood hazard assessment, and economic and policy implications of flood map accuracy. Information on these topics was gathered from the literature, the Asso¬ciation of State Floodplain Managers, discussions with colleagues, and briefings at five committee meetings held between June 2007 and April 2008. In addition to these traditional means of gathering information, the committee conducted original analyses of variables that influence flood map accuracy, such as elevation and flood flow. The Committee also recommended method to reduce the uncertainty associated with coastal flood maps. In 2007, European nations agreed to adopt a risk based approach in flood management, with an aim to reduce the overall flood risk, which is defined as the probability of an event multiplied by its consequences. This can be done through limiting the magnitude and probability of the flood (the hazard), the damage potential (the exposure), and/or the way flood events are dealt with (cope capacity). Flood protection in different countries is aimed at “extreme events” with different annual chance of occurrence. In the Netherlands, flood protection is aimed at “extreme flood” which has an annual chance of occurrence of 0.01%. The figure below shows a number of different flood map types produced in Europe.
|

 |
Please address comments and questions to hurricane@etal.uri.edu