
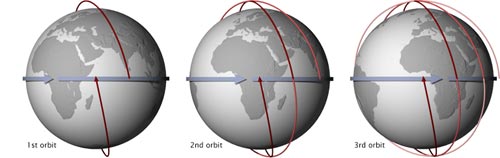
The National Oceanic and Atmospheric Administration (NOAA) operates two sets of satellites to monitor the weather: geostationary satellites (geostationary operational environmental satellites - GOES) and low Earth orbit satellites - POES. Weather data is also available from Defense Meteorological Satellite Program (DMSP) satellites in low Earth orbits. The NOAA low Earth orbit weather satellites are operated in a special polar orbit, a sun synchronous orbit. In a sun synchronous orbit, the satellite passes over the same spot on Earth each day at the same time. The satellites are operated in pairs with one satellite making a morning pass and the other satellite making an afternoon pass. This pattern ensures that every spot on the Earth is observed by a NOAA weather satellite at least every six hours and typically every four hours.
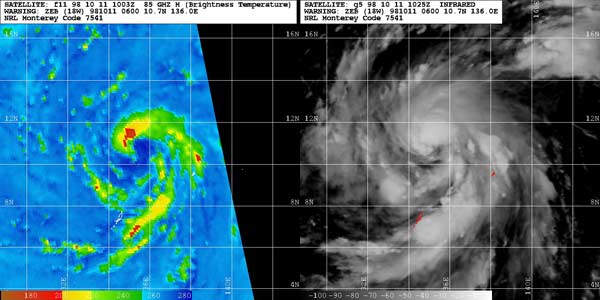
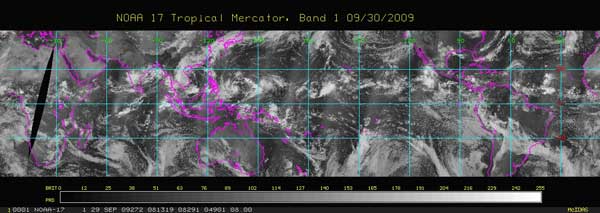
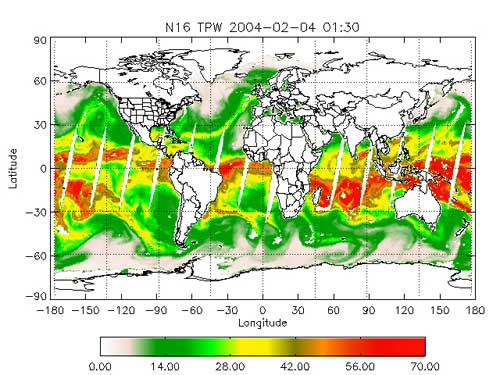
There are multiple instruments on the NOAA low Earth orbit satellites. Some of the data the POES satellites collect globally every day include: information on cloud cover, surface distribution of ice and snow, temperature and moisture in the atmosphere, sea surface temperature (SST), land surface temperature and distributions of aerosols and ozone. An important advantage of low Earth orbit satellites over GOES is that they can detect temperature and moisture structure below the cloud top due to the use of microwave instruments as they are much closer to the Earth. Passive microwave imagery from the NOAA weather satellites and DMSP satellites shows features that cannot be seen with other sensors due to high cloud cover obscuring the view. Passive microwaves "see through" non-raining clouds and view rainbands, eyewalls and eyes even when obscured by upper-level clouds. The microwave data provides good information on precipitation and clouds at low and medium levels. It gives valuable clues concerning the intensity and position of storms. This data is used in weather forecasts and the forecasting and modeling of tropical cyclones.
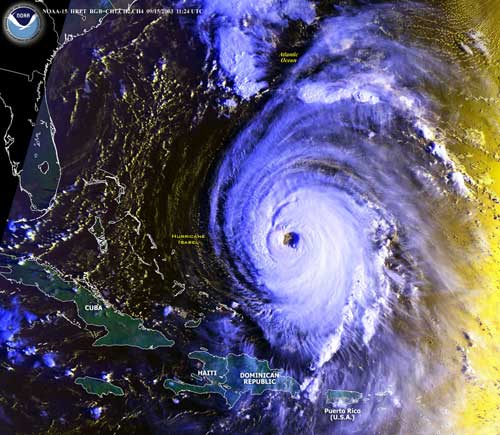
Examples of the imagery produced by the NOAA low Earth orbit satellites are seen below.
|
 |
Please address comments and questions to hurricane@etal.uri.edu