
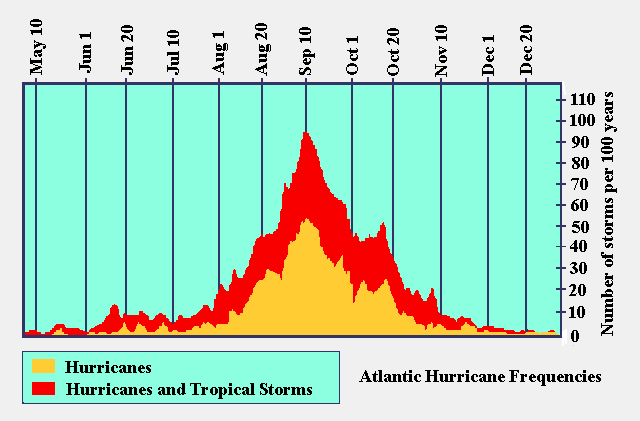
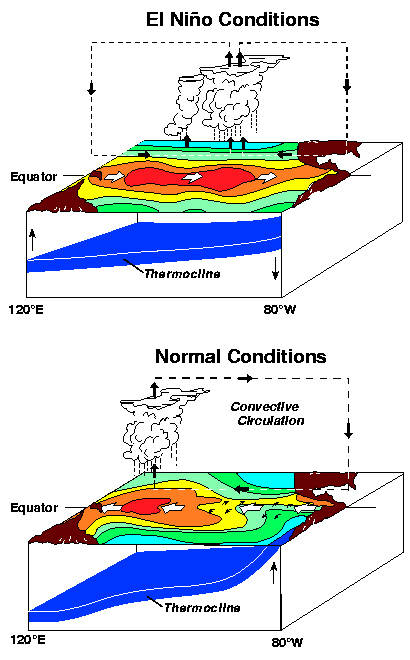
Hurricane activity varies over different time cycles, and the reasons for this variability are not all well-understood. One cycle that is well-defined in the Atlantic Region, however, is the annual Atlantic hurricane season, which runs from June 1st to November 30th each year. These dates were selected by the U.S. National Hurricane Center (NHC) to include approximately 97% of the tropical cyclone activity in the Atlantic Basin. The graph below shows the average distribution of hurricane and tropical storm activity throughout the year. From this graph, it is clear that the majority of tropical cyclones in the Atlantic Basin occur between August and October with a peak in September. One study suggests that this season may be slowly getting longer due to climate change (see Hurricanes and Climate), but more research is needed. Other ocean basins have different tropical cyclone seasons, but generally speaking, tropical cyclones tend to form during the summer and fall (in each hemisphere). At this time of year, the favorable ingredients for tropical cyclone formation are most likely to be in place (see Hurricane Genesis: Birth of a Hurricane). The interesting exception may be the northwest Pacific Region, where typhoons occasionally form in winter and spring. Also, tropical cyclone activity over the North Indian Ocean (NIO) has a bimodal structure, with peaks of activity in November and May. Typically, tropical cyclone frequency in the NIO is related to monsoon depressions. At the beginning and end of the summer monsoon season, the depressions tend to have longer tracks over water, increasing the likelihood of tropical cyclone formation. Another cause of tropical cyclone variability is the El Nino-Southern Oscillation (ENSO). ENSO is the term used to define the oceanic El Nino/ La Nina cycle and the associated atmospheric Southern Oscillation. El Nino and La Nina are terms used to describe alternate periods, lasting a year or so, of unusually warm and cool waters, respectively, in the equatorial Pacific Ocean and off the coast of South America. During an El Nino event, the sea surface temperature (SST) in the eastern and central tropical Pacific basin warms to above the average normal temperature. On average, the Western Pacific is about 8°C (14.4°F) warmer than the Eastern Pacific. During an El Nino year, the westward-blowing trade winds, which cause upwelling of cool sub-surface waters, in the east, relax. Subsequently, the surface waters in the Eastern tropical Pacific can become a few degrees warmer than usual.
The sea surface warming associated with El Nino in the equatorial Pacific also affects atmospheric circulation. During an El Nino year, the Southern Oscillation Index (SOI), based on the sea level pressure difference between weather stations at Tahiti ( in the eastern Pacific) and Darwin, Australia becomes negative (below-normal air pressure at Tahiti and above-normal air pressure at Darwin). During a La Nina year, there is an intensification of the westward-blowing trade winds, East Pacific equatorial upwelling of cold water is enhanced, and the sea surface temperature in the eastern and central tropical Pacific basin cools below normal, while the SOI becomes positive. In the troposphere within the Atlantic basin, El Nino events tend to both increase vertical wind shear and dry out and warm the environmental temperature profile above the sea surface, thereby suppressing Atlantic tropical cyclone activity (see Hurricane Genesis: Birth of a Hurricane). La Nina, on the other hand, tends to enhance Atlantic activity because of reduced vertical wind shear and a cooler atmospheric temperature profile Data from 1900-1997 suggest that the chance of two or more hurricanes making landfall anywhere in the continental U.S. during an El Nino year is 28%, compared with 48% at other times and 66% during a La Nina period. The probabilities for at least one major hurricane striking are 23%, 58% and 63%, respectively. It is important to note that an El Nino event does not necessarily mean a season without any major hurricanes. Hurricane Betsy (1965), Hurricane Agnes (1972), and Hurricane Andrew (1992) all occurred during El Nino events and caused $9.7 billion, $10.8 billion, and $40.7 billion of damage, respectively (in 2009 USD).
ENSO strongly affects tropical cyclone activity in other parts of the world. Effects similar to that in the Atlantic basin are also observed in the south Pacific (i.e. near Australia), where more cyclones occur and make landfall in years when there is a positive SOI (La Nina). On the other hand, in areas of the North Pacific (e.g. near Hawaii and Guam), El Nino events cause an increase in tropical cyclone activity. Other locations, such as the southwest and North Indian Ocean region, have shown an ambiguous (or small) ENSO relationship. This relationship has not been examined yet in sufficient detail. Anthropogenic climate change may affect ENSO and thereby affect hurricane activity, but this connection is still unclear (for more information, please see Hurricanes and Climate). In addition to the seasonal cycle and ENSO, other natural climate variations may influence Atlantic hurricane activity, including the Madden-Julian Oscillation (MJO), the Atlantic Meridional Mode (AMM), and the North Atlantic oscillation (NAO). This variability affects the tropical Atlantic on time scales of a few weeks to a few years. On longer (e.g. multidecadal) time scales, there is strong variability in the Atlantic that affects storm activity. The MJO describes areas of increased and decreased rainfall and tropical winds near the equator, which evolves with a time scale of 30-60 days. The MJO modulates atmospheric humidity, winds, and temperature in ways that affect tropical cyclone activity in certain regions. During an event, the MJO pattern develops over the Indian Ocean and then moves eastward into the western Pacific Ocean. Later, the MJO moves further east and influences tropical cyclone activity over the Northeast Pacific and the Gulf of Mexico. Similar to ENSO, the AMM describes a mutual interaction between the sea surface temperatures and the overlying air circulations (wind). When the AMM is in its positive phase, the ocean and atmosphere in the Atlantic is organized in a way that promotes more hurricane activity (warmer water, lower shear, etc.). The NAO describes the gradient or contrast between a mid-latitude high-pressure system over the Azores and an arctic low-pressure system over Iceland. The NAO influences atmospheric circulation patterns over the Atlantic, which may influence the seasonal tracks of Atlantic hurricanes. There is other variability that affects both the tropical sea surface temperature and the atmospheric circulation on decadal and longer time scales, however, recent scientific debate has been focused on the extent to which long-term changes in tropical cyclone activity may be attributed to natural variability as opposed to anthropogenically-forced climate change. For example, the multidecadal variability of Atlantic tropical cyclones may be influenced by natural variability of the Atlantic, including a phenomenon known as the Atlantic Multidecadal Oscillation (AMO), as well as external forcing, including anthropogenic effects. Since the record of accurate tropical cyclone activity is short compared to this variability, it is difficult to separate the causes of variability on these longer time scales (see Hurricanes and Climate). arctic |
 |
Please address comments and questions to hurricane@etal.uri.edu